
How Rila Group Scaled an Influencer Merchant’s Shopify & Amazon Empire
In the hyper-competitive world of e-commerce, “having data” is no longer enough. For high-volume influencer merchants and Amazon sellers, the challenge isn’t a lack of information it’s the fragmented spreadsheets and hidden patterns buried within years of historical Shopify data.
When a leading influencer merchant sought to break through their revenue ceiling, they turned to Rila Group Inc. for a full-scale historical data analysis. The goal was clear: identify the specific “low-hanging fruit” drivers of growth and turn a successful storefront into a data-driven powerhouse.
The Challenge: Drowning in Data, Starving for Strategy
Many Shopify merchants operate on “gut feeling” and basic platform dashboards. This merchant faced three common scaling bottlenecks:
-
Historical Blind Spots: Years of customer data sat unanalyzed, hiding long-term retention trends.
-
Multi-Channel Fragmentation: Difficulty reconciling Amazon sales velocity with Shopify store behavior.
-
Static Reporting: Manual data pulls were taking hours, leaving little time for actual strategy.
The Rila Group Approach: A Full-Spectrum Data Audit
Rila Group’s intervention focused on three core pillars of e-commerce excellence: Revenue Drivers, Customer Behavior, and Growth Opportunities.
1. Identifying Key Revenue Drivers
Rila Group moved beyond “Total Sales” to look at Contribution Margin per SKU. By analyzing historical performance, they identified which products were true “anchors” for the brand and which were “margin-bleeders” hidden by high top-line revenue.
-
Action: Optimized the product mix to focus on high-LTV (Lifetime Value) items.
-
Result: A measurable increase in net profitability without increasing ad spend.
2. Decoding Influencer-Driven Customer Behavior
For an influencer-led brand, timing is everything. Rila Group analyzed the “decay rate” of influencer-driven traffic.
-
The Insight: They discovered that while initial spikes were high, the “second-purchase” window was missed 60% of the time.
-
The Fix: Implementation of automated, behavior-triggered email flows based on historical purchase intervals.
3. Uncovering “Low-Hanging Fruit” Growth Opportunities
By auditing the Shopify-to-Amazon ecosystem, Rila Group identified a 15% discrepancy in inventory allocation. Products were stocking out on Amazon while sitting idle in Shopify warehouses.
-
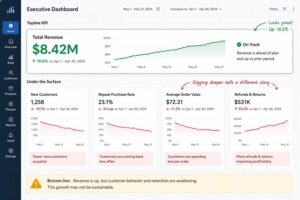
The Solution: An Automated KPI Dashboard that provided real-time visibility across all sales channels.
-
The Impact: Eliminated stock-outs and reduced manual reporting time by over 80%.
“Rila Group doesn’t just provide a report; they provide a roadmap. They turned our historical data into a predictive tool for our next product launch.” — Merchant Stakeholder
Why Data Visualization is the Secret Weapon for E-Commerce
One of the most immediate “quick wins” Rila Group provides is moving merchants from “spreadsheet fatigue” to Real-Time Data Visualization. * Clarity at a Glance: See which influencer campaigns are driving ROI in seconds, not hours.
-
Actionable Intelligence: Dashboards that highlight what to do next, rather than just showing what happened.
Scale Your Store with Rila Group Inc.
Are you sitting on a goldmine of unanalyzed Shopify or Amazon data? Rila Group specializes in helping mid-size logistics and e-commerce firms reduce reporting overhead and maximize commercial impact.
Stop guessing and start growing.
Ready to uncover your next growth opportunity? Contact Rila Group Today to schedule your Historical Data Assessment and see how we can turn your analytics into a competitive advantage.